 Piratul Politic
Fact check: salary taxation versus perceived safety [EN]
Showing in red what’s false, black what’s correct
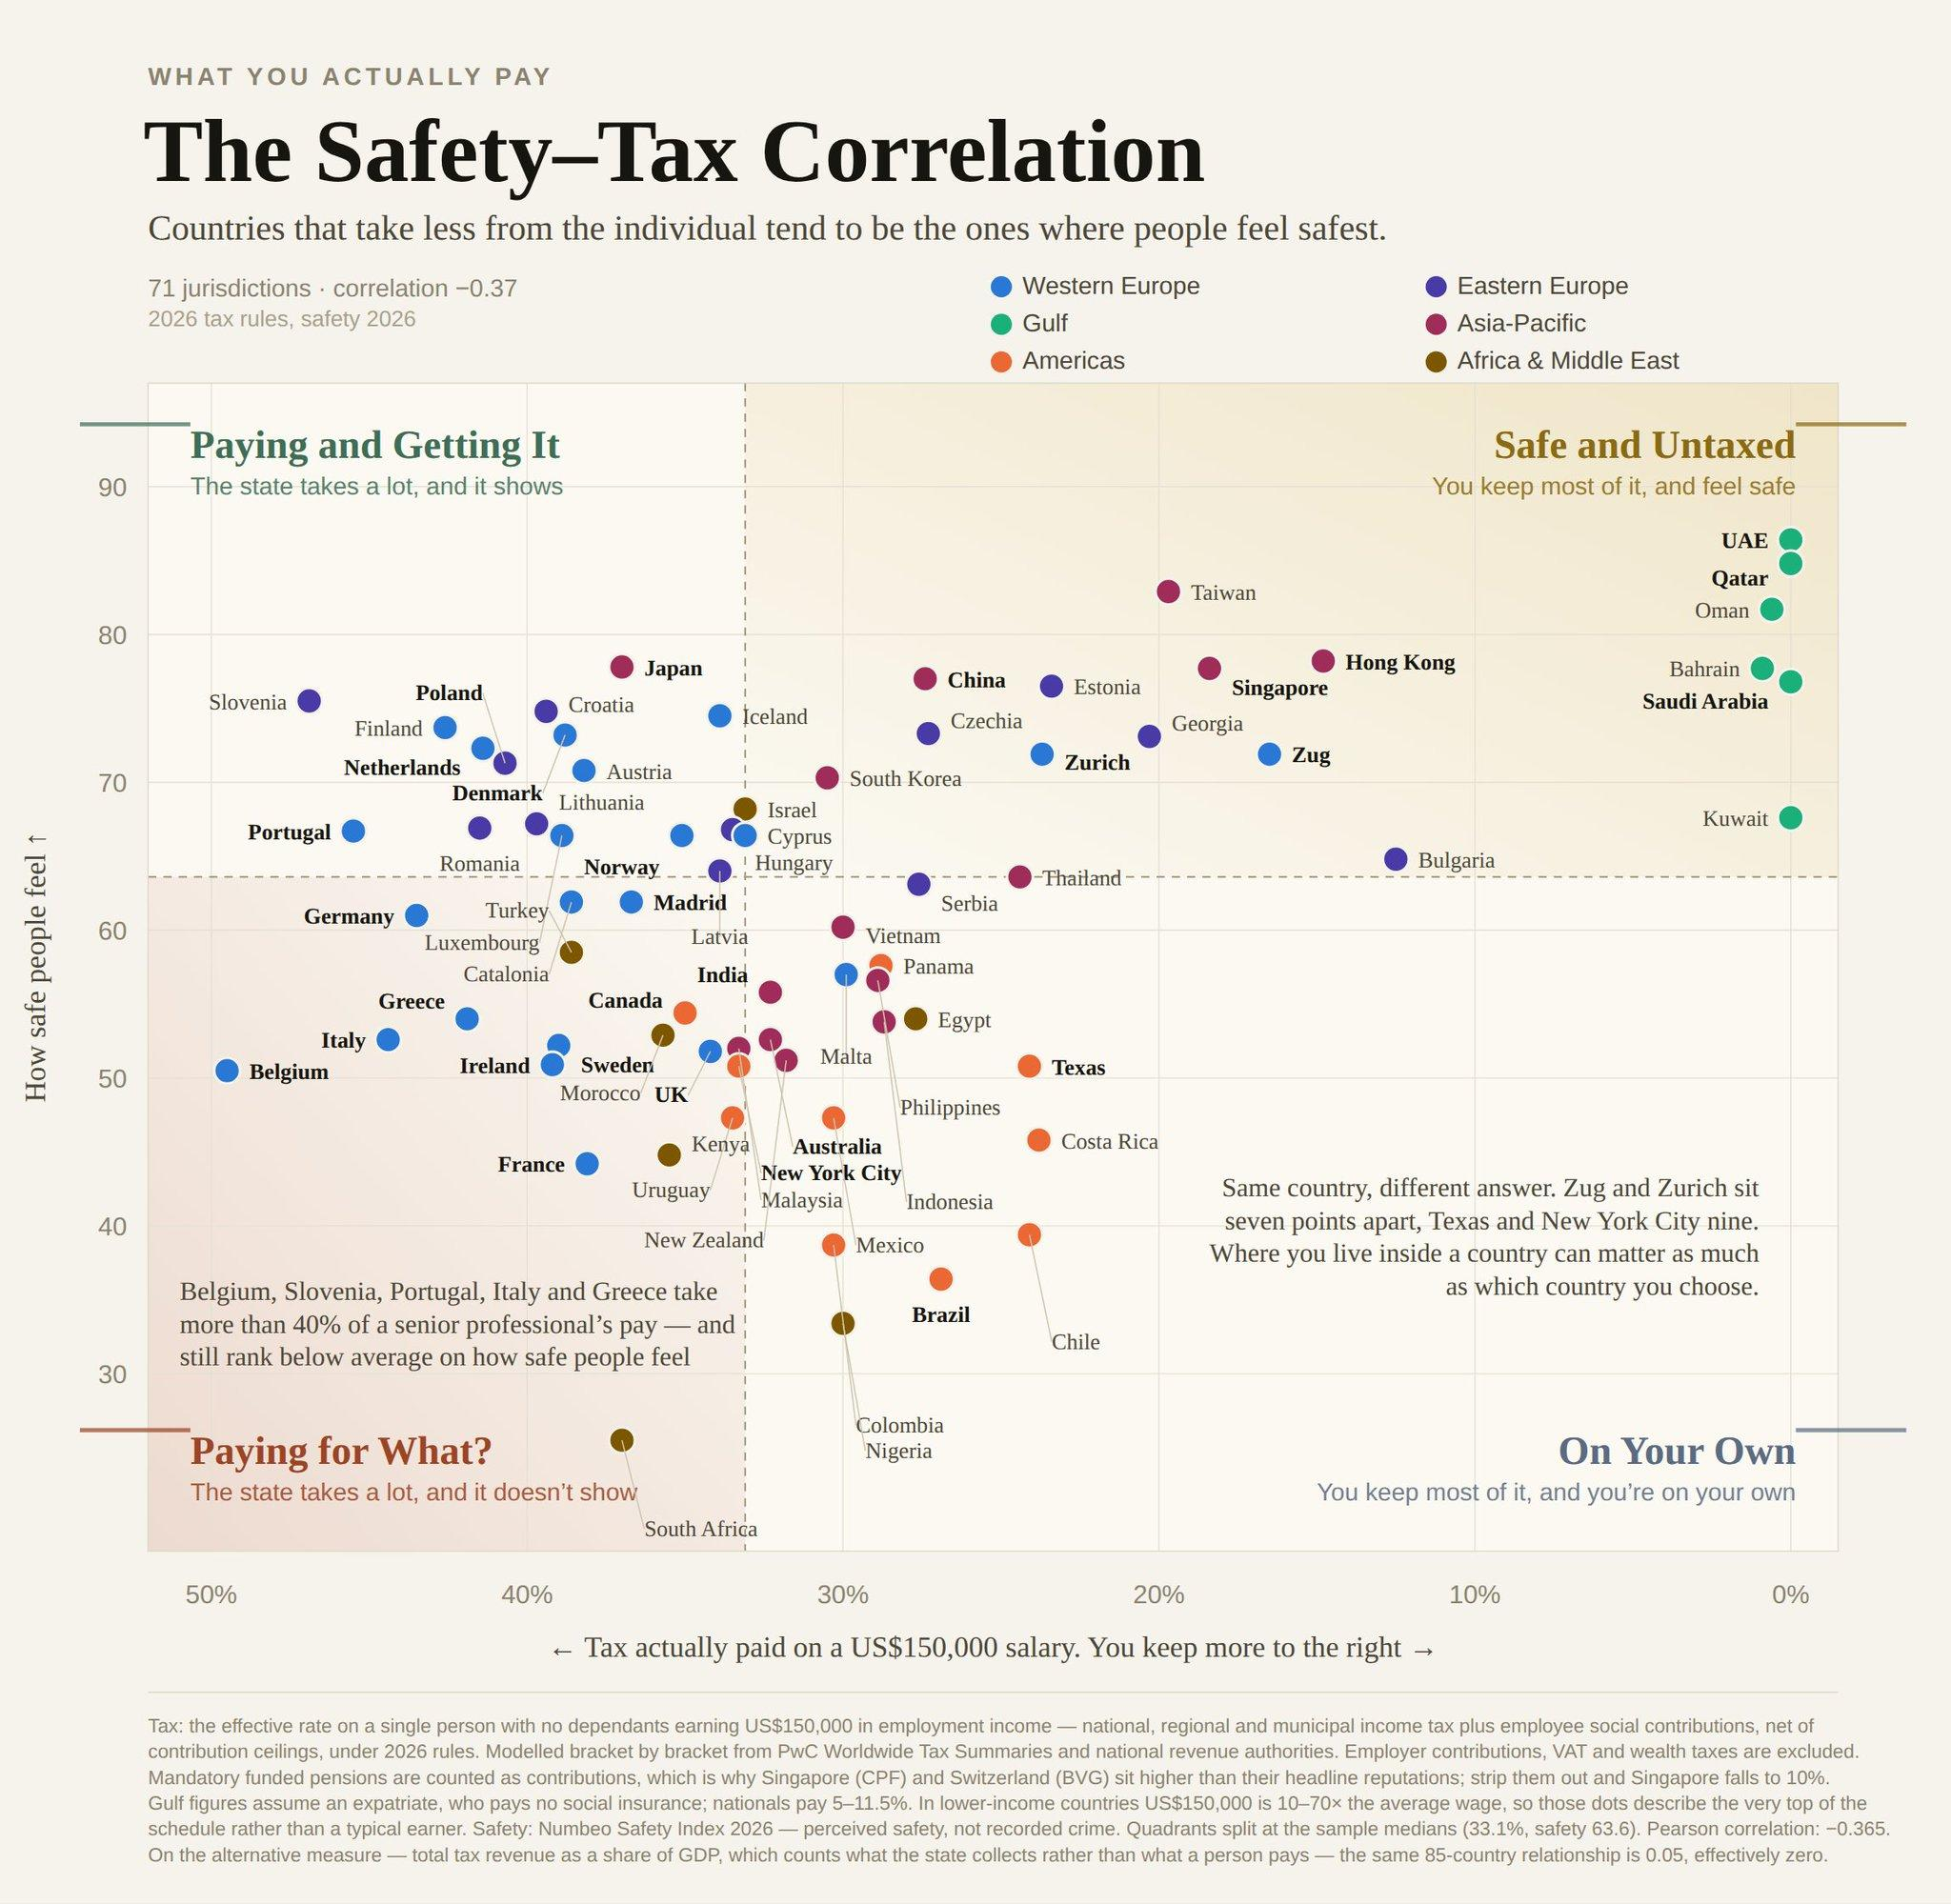
The chart states: “Belgium, Slovenia, Portugal, Italy and Greece take more than 40% of a senior professional’s pay and still rank below average on how safe people feel.”
The chart’s own median line: 63.6.
| Country | Safety as plotted | |
|---|---|---|
| Slovenia | 75.5 | above the line |
| Portugal | 66.5 | above the line |
| Belgium | 50.5 | below the line |
| Italy | 52.5 | below the line |
| Greece | 54.0 | below the line |
Of the 11 jurisdictions taxed above 40%, 7 should sit above the safety median: Slovenia 75.5, Finland 73.5, Netherlands 72.5, Denmark 72.0, Poland 72.0, Portugal 66.5, Romania 66.5.
The safety calculations and fact check
The chart states: “Countries that take less from the individual tend to be the ones where people feel safest”, correlation −0.365.
| Sample | n | r | p |
|---|---|---|---|
| Full, in the image | 71 | −0.351 | 0.003 |
| Excluding the 6 Gulf states | 65 | −0.080 | 0.53 |
| Excluding Gulf and sub-national units | 59 | −0.047 | 0.73 |
| Excluding authoritarian and hybrid regimes | 55 | +0.078 | 0.57 |
| Democracies only | 54 | +0.062 | n.s. |
| Europe only | 34 | −0.233 | 0.19 |
| Rich democracies only | 29 | −0.138 | 0.47 |
Six of the 71 points produce 77% of the correlation. Without them the relationship is no longer statistically significant. Without the authoritarian regimes the sign flips.
Within-region correlations: Americas +0.284, Eastern Europe +0.162, Gulf +0.295, Western Europe −0.262, Africa and Middle East −0.024.
The chart’s own footnote: “the same 85-country relationship is 0.05, effectively zero”.
Tax figures correction
| Jurisdiction | In the image | Recalculated (real) | Source |
|---|---|---|---|
| Norway | 38% | 35.1% | PwC, skatteetaten.no |
| Cyprus | 33.5% | 30.68% | PwC |
| Costa Rica | 24% | 26.71% | PwC |
| Serbia | 27.5% | 25.12% | PwC, purs.gov.rs |
| Malaysia | 31% | 33.28% | PwC, hasil.gov.my |
| Lithuania | 39% | 41.26% | PwC, vmi.lt |
Recalculation based on real data.
The safety axis
The chart states: “Safety: Numbeo Safety Index 2026”.
Numbeo publishes no safety index for Catalonia or Texas. It ranks countries and cities, not sub-national regions, so those two points do not come from the cited dataset.
Zug is plotted at roughly 72. Numbeo’s entry for Zug reads 80.73, drawn from 52 contributors and last updated June 2024.
The chart also mixes Numbeo’s country index and its city index on a single axis, but I get its point since cities in different lands can behave like different countries under decentralized regimes.
Source: Numbeo Safety Index 2026, city rankings.
Mostly true
But apparently most of the data is true, and the small differences do not change the graphic too much.